
Loss function in AI and Deep learning
Loss function in AI and Deep Learning measures how correctly your AI model predicts the expected outcome. 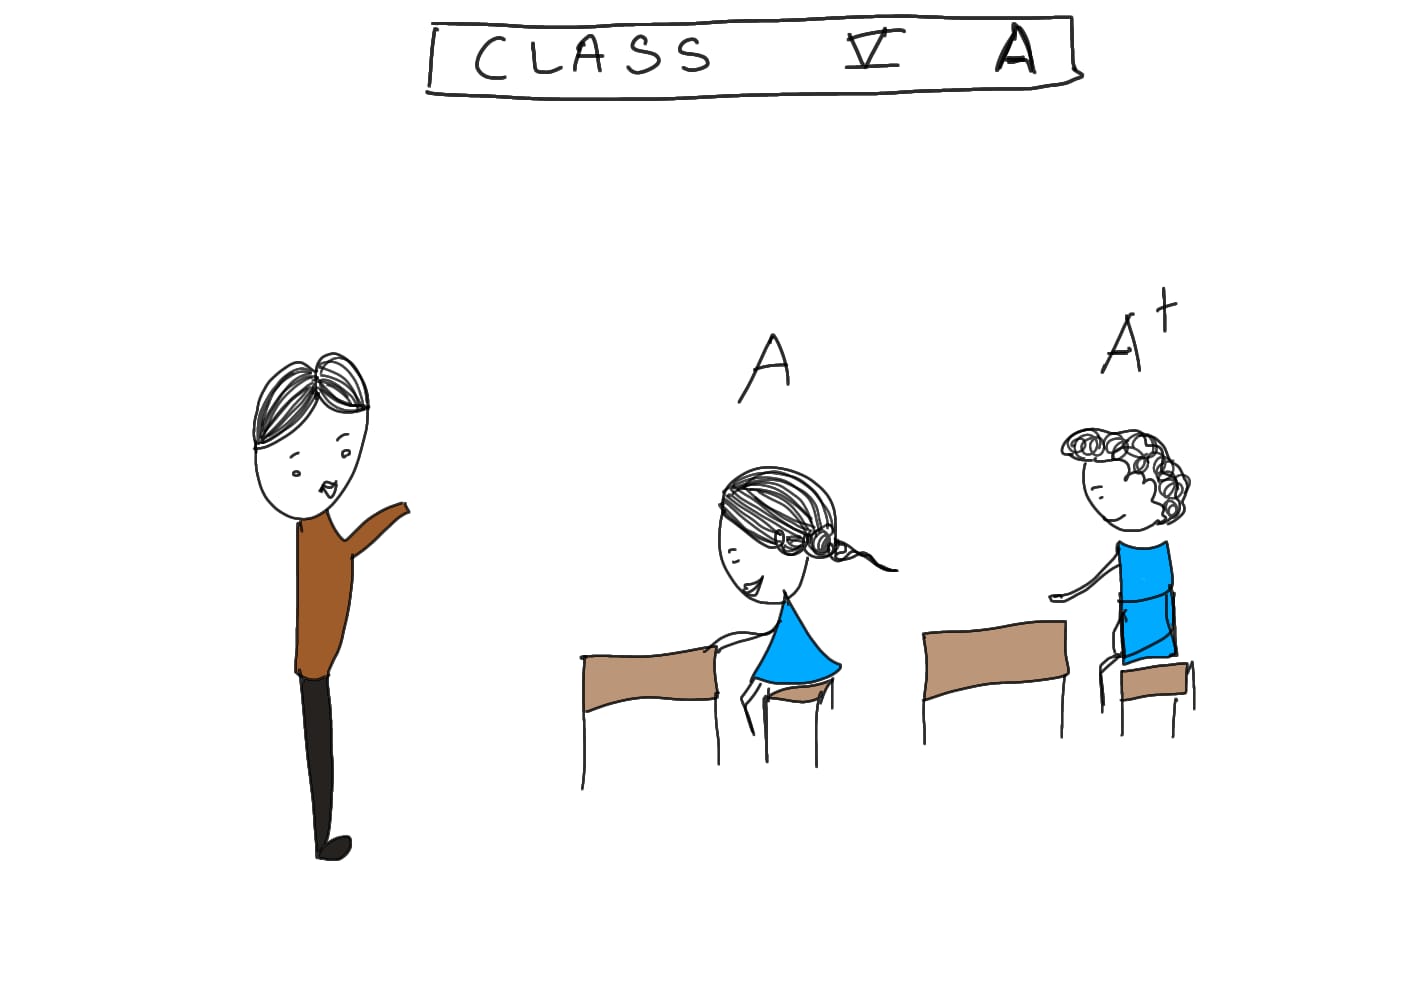
We use different loss functions for regression analysis and classification analysis.
Let us understand through a simple example.
Consider you have created an AI model to predict whether the student fits in Grade A, A+, or A-. It calculates a few parameters like marks of all the subjects in theory, practical, and projects to predict the grades.
The system may not predict correct grades in the first go resulting in a loss. This loss is used in backpropagation to reduce faulty predictions.
Learn how to get better accuracy by using Activation functions – Click here
Loss = Desired output – actual output (Expected – reality)
If your loss function value is low, your model will provide good results. Thus, we should try to get a minimum loss value (high accuracy).
After forward propagation, we find the loss and reduce it. Now, let us learn about different types of loss functions.
How to reduce loss? What is loss function in machine learning? What is cost function?
We calculate the loss using the loss function and cost function.
The terms cost and loss functions almost all refer to the same meaning. The cost function measures error on a group of objects, and the loss function deals with a single data instance.
Loss function: Refers to error for a single training example.
Cost function: Refers to an average loss over an entire training dataset.
Do you recollect the above example to grade the students? The loss function evaluates the model’s performance for one student; the cost function evaluates the performance of the entire class. Therefore, to optimize our model, we need to minimize the value of the cost function.
We use different types of loss functions for different types of Deep learning problems.
There are two types of problems in supervised Deep Learning
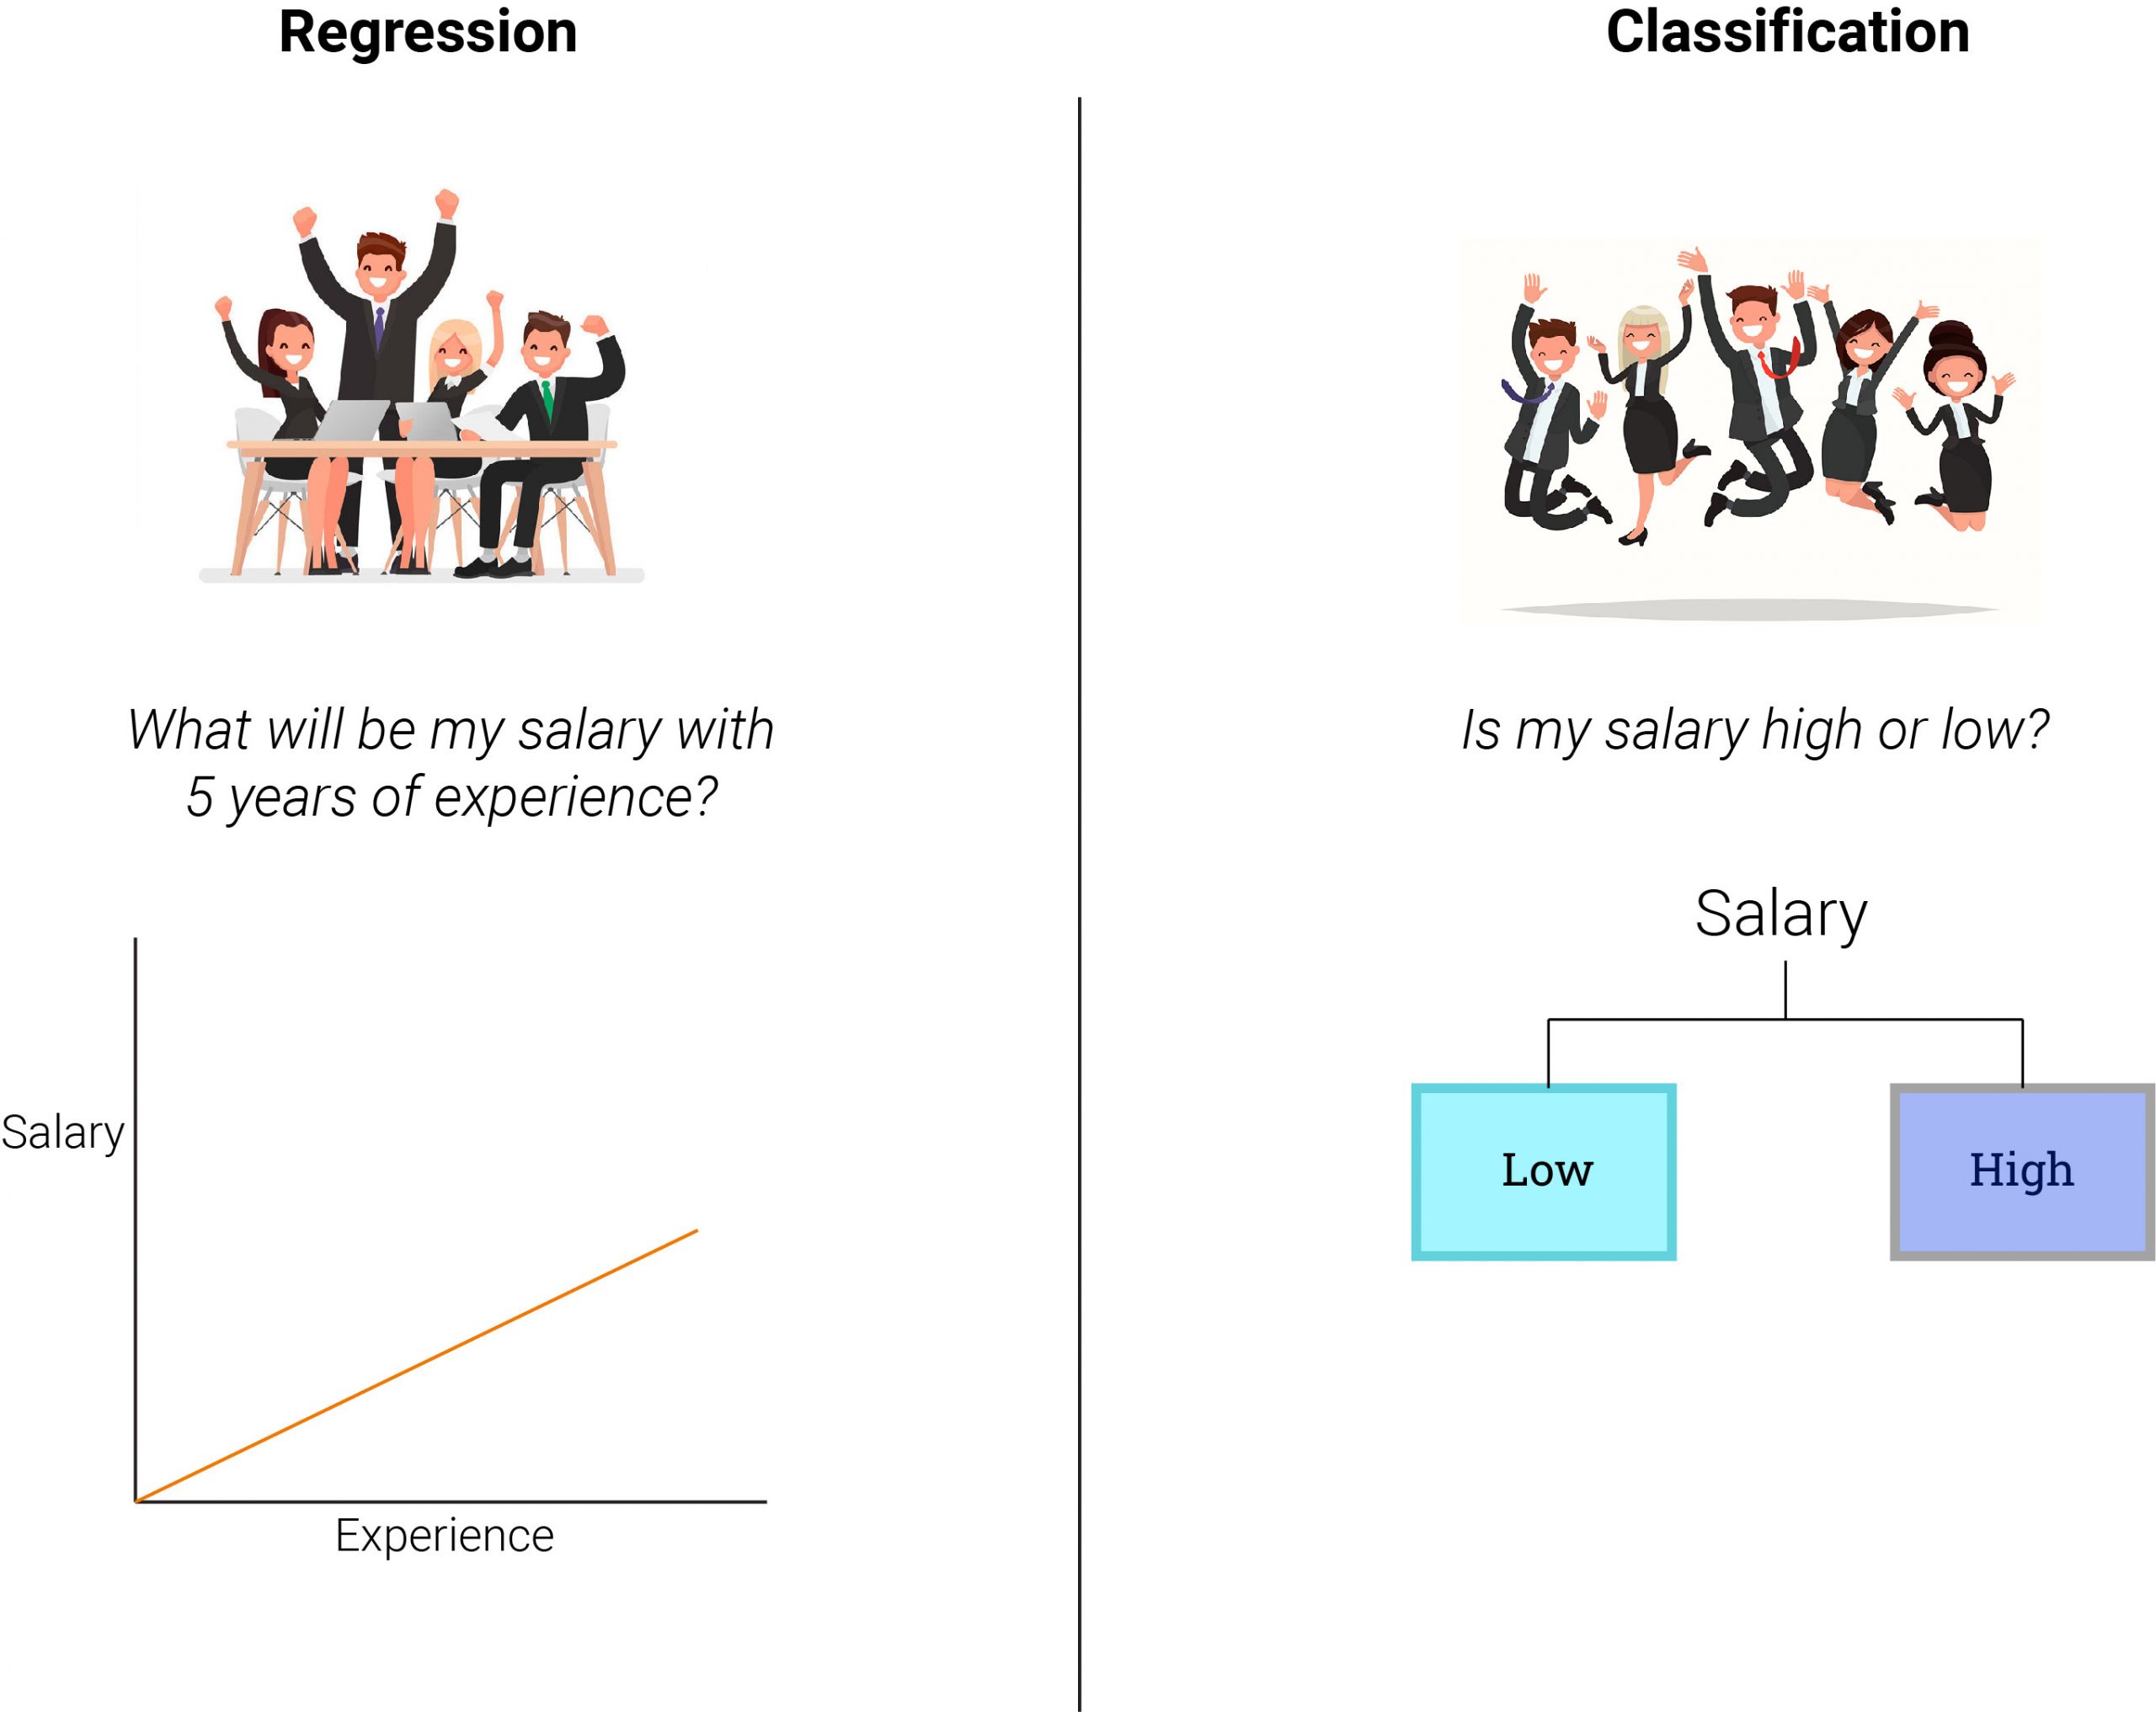
Regression
The salary of an employee depends on the experience the employee has. Consequently, salary is a dependent variable known as the target, and experience is an independent variable known as the predictor.
Regression analysis explains to us how the value of the dependent variable changes based on the independent variable. It is a supervised learning technique that helps us to find the correlation between variables and predict the continuous output variable. We use it for prediction, forecasting, and determining the causal-effect relationship between variables.
The loss functions used for regression examples –
We use distance-based error as follows:
Error = y – y’
Where y = actual output & y’ = predicted output
The most used regression cost functions are below.
1. Mean error (ME):
Mean error = Sum of all errors /number of training examples
= {( Y1 – Y1’) + ( Y2 – Y2’ ) + ( Y3 – Y3’ ) + ….. + ( Yn – Yn’)}
n
= (+100 + -100) / 2
= 0 / 2 = 0.
· Here, we calculate the error for each training data and derive their mean value.
· The errors can be positive and negative, sometimes resulting in a zero mean error for the model.
· Therefore, this is used as a base for other cost functions.
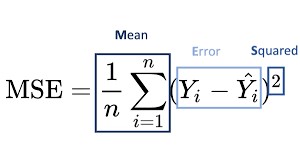
2. Mean Squared Error (MSE)
We use the mean squared error to get rid of the zero mean error. MSE is also known as L2 loss. We consider the square of the difference between the predicted and the actual value.
Advantages
· We can penalize the tiny deviations in predictions compared to MAE.
· It has only one local minima, and one global minima; converges faster, and is differentiable.
Disadvantages
· It is not robust to outliers. These outliers contribute to higher prediction errors, and squaring them further magnifies the error.
This equation is quadratic, resulting in gradient descent.
Info byte
OUTLIERS:
Say if we are predicting the value of the salary of a candidate. The salary depends on the experience of the candidate. And for that, we have a dataset of the salary and experience. Here, the salary might be very high or low in some cases, irrespective of their experience. These exceptions are known as outliers in a dataset that contribute to higher prediction errors.
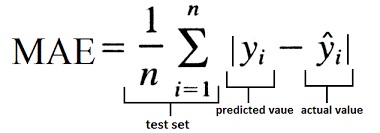
3. Mean Absolute Error (MAE)
MAE eliminates the ME shortcoming differently. Here, we consider the absolute difference between the actual and predicted value. It is measured as an average sum of absolute differences between actual and predicted values. MAE is also known as L1 loss.
Advantages
· Robust to outliers since we take the absolute value instead of squaring the errors.
· Gives better results even when the dataset has noise or outliers.
Disadvantages
1. It is a time-consuming function.
4. Huber Loss
Say we have salary values of 100 employees. Out of which, 12 employees have very high salaries, and 12 have very low salaries. Though these extremes fit in the definition of outliers, we cannot ignore them as they are about 25 percent of the dataset.
What do we do here? We use the Huber loss function.
The Huber loss function can be used to balance between MSE and MAE. It is a blend of mean squared error (MSE) and mean absolute error (MAE).
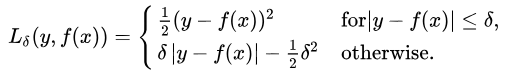
One thing we have to define here is the delta value. Delta is the hyperparameter that decides the range of MSE and MAE. When the error is less than the delta, the error is quadratic, otherwise absolute.
Delta can be iterative to find a correct delta value.
This equation says that, for a loss value less than delta, use the MSE. Use MSE when no outliers are present in the dataset. For loss value greater than delta, use the MAE.
Classification
Calculating the loss in classification is a little tricky.
Infobyte
What is entropy?
Entropy is a measure of the randomness, unpredictability, disorder, or impurity in a system.
Classification tasks are those in which the given data is classified into two or more categories.
For example, the classification of dogs and cats.
Types of Classification
In general, there are three main types/categories for Classification in machine learning:
A. Binary classification
This includes two target classes.
• Is it a cat in the picture? Yes or No
| Object | Target | Prediction(Probability) |
| Yes | 1 | 0.8 |
| No | 0 | 0.2 |
• Is it a cat or a dog in the picture? Cat or Dog
B. Multi-Class Classification

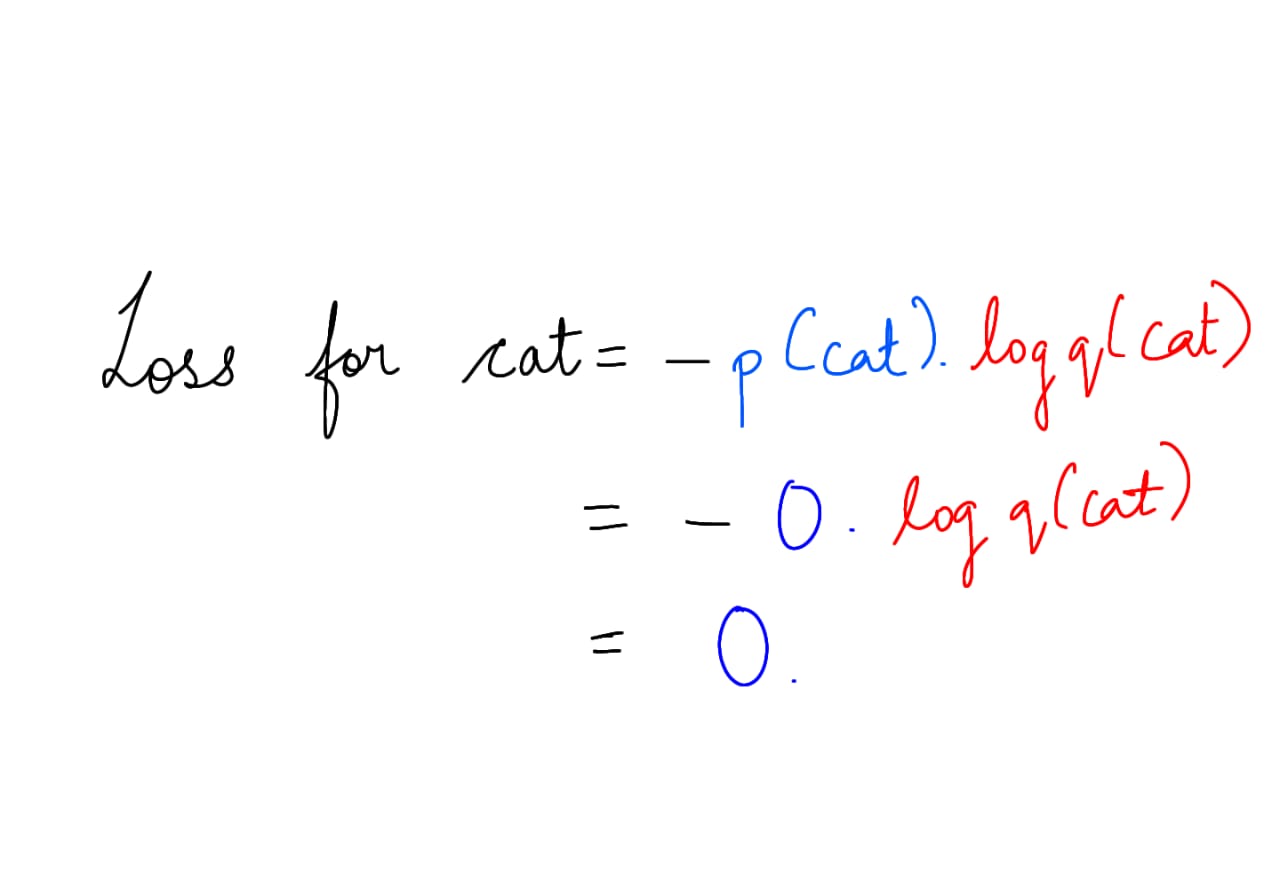
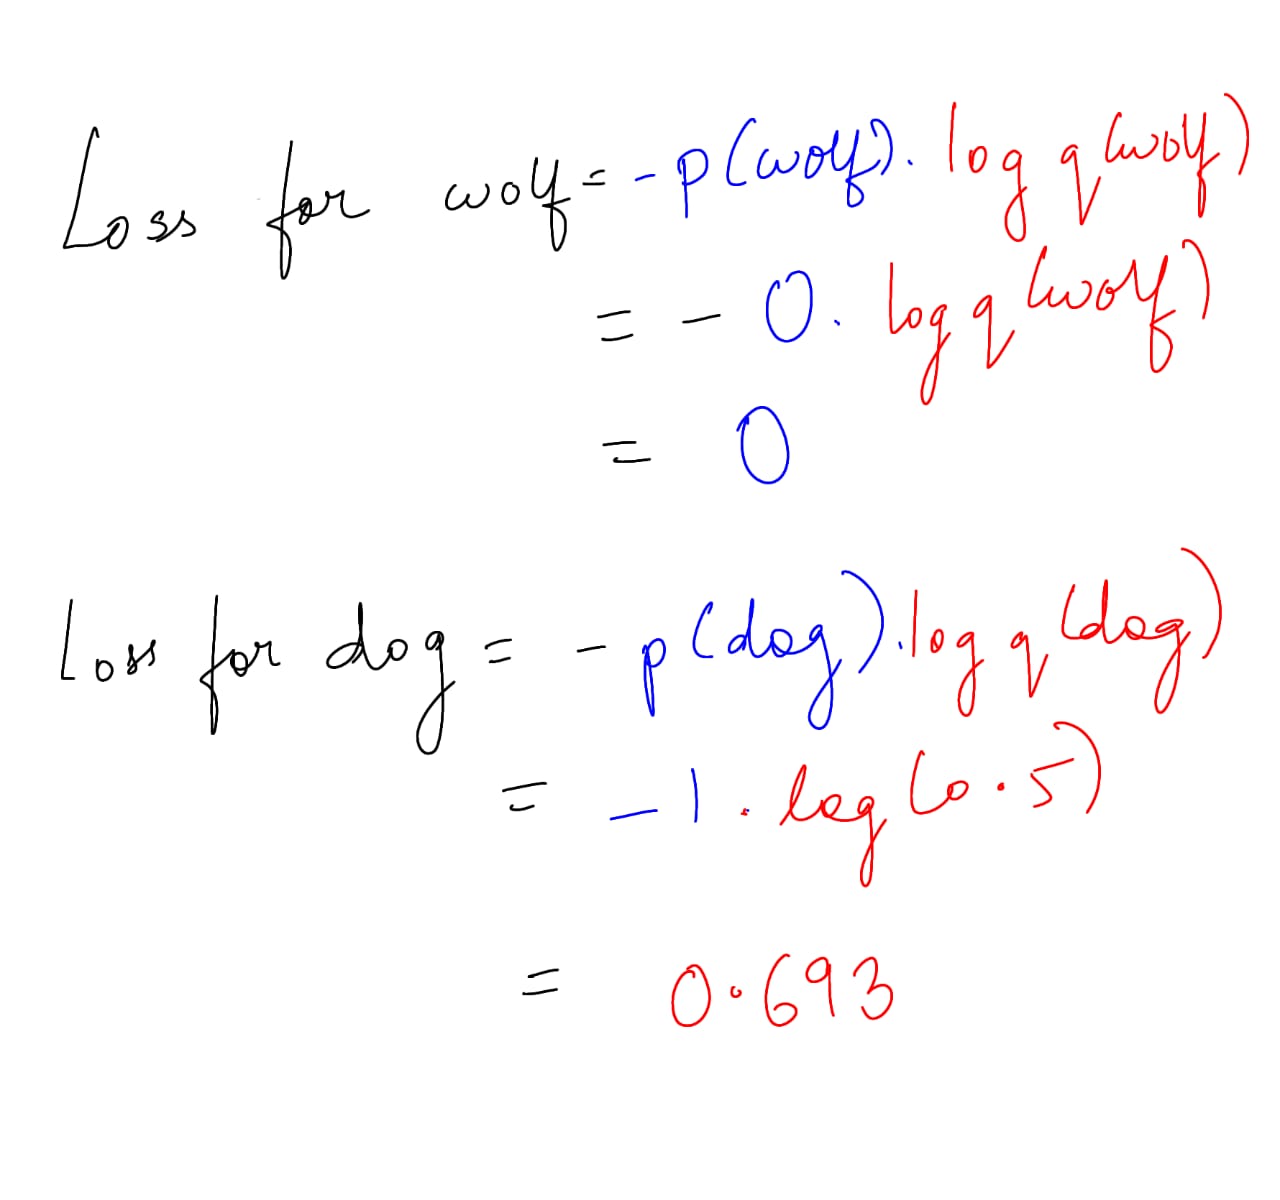
| Object | Target | Prediction(Probability) |
| Dog | 1 | 0.5 |
| Cat | 0 | 0.2 |
| Wolf | 0 | 0.3 |
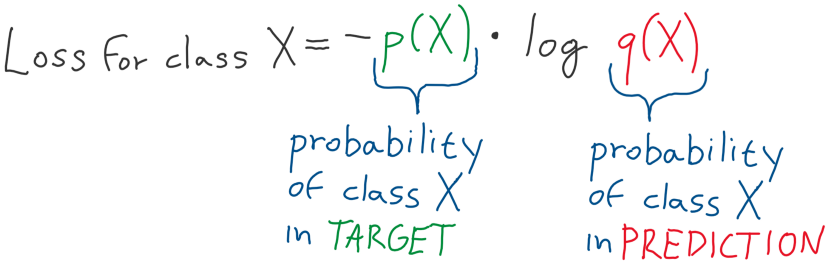
The prediction of a model is a probability, and all these probabilities add up to 1. The target for multi-class classification is one hot vector, which means it has 1 on a single position and 0 everywhere else.
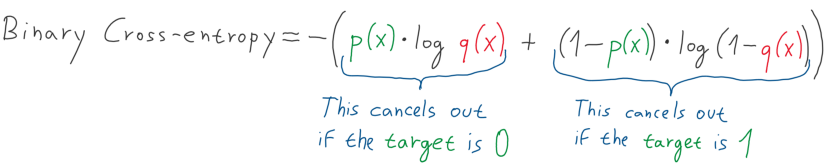
First, let us start calculating separately for each class and then sum it up.

Binary entropy is a particular case of entropy used if our target is either 1 or 0. In a neural network, we achieve this prediction by using the Sigma activation function –
How to create a classifier – Check here.
Say I want to predict whether the image contains a cat or not.
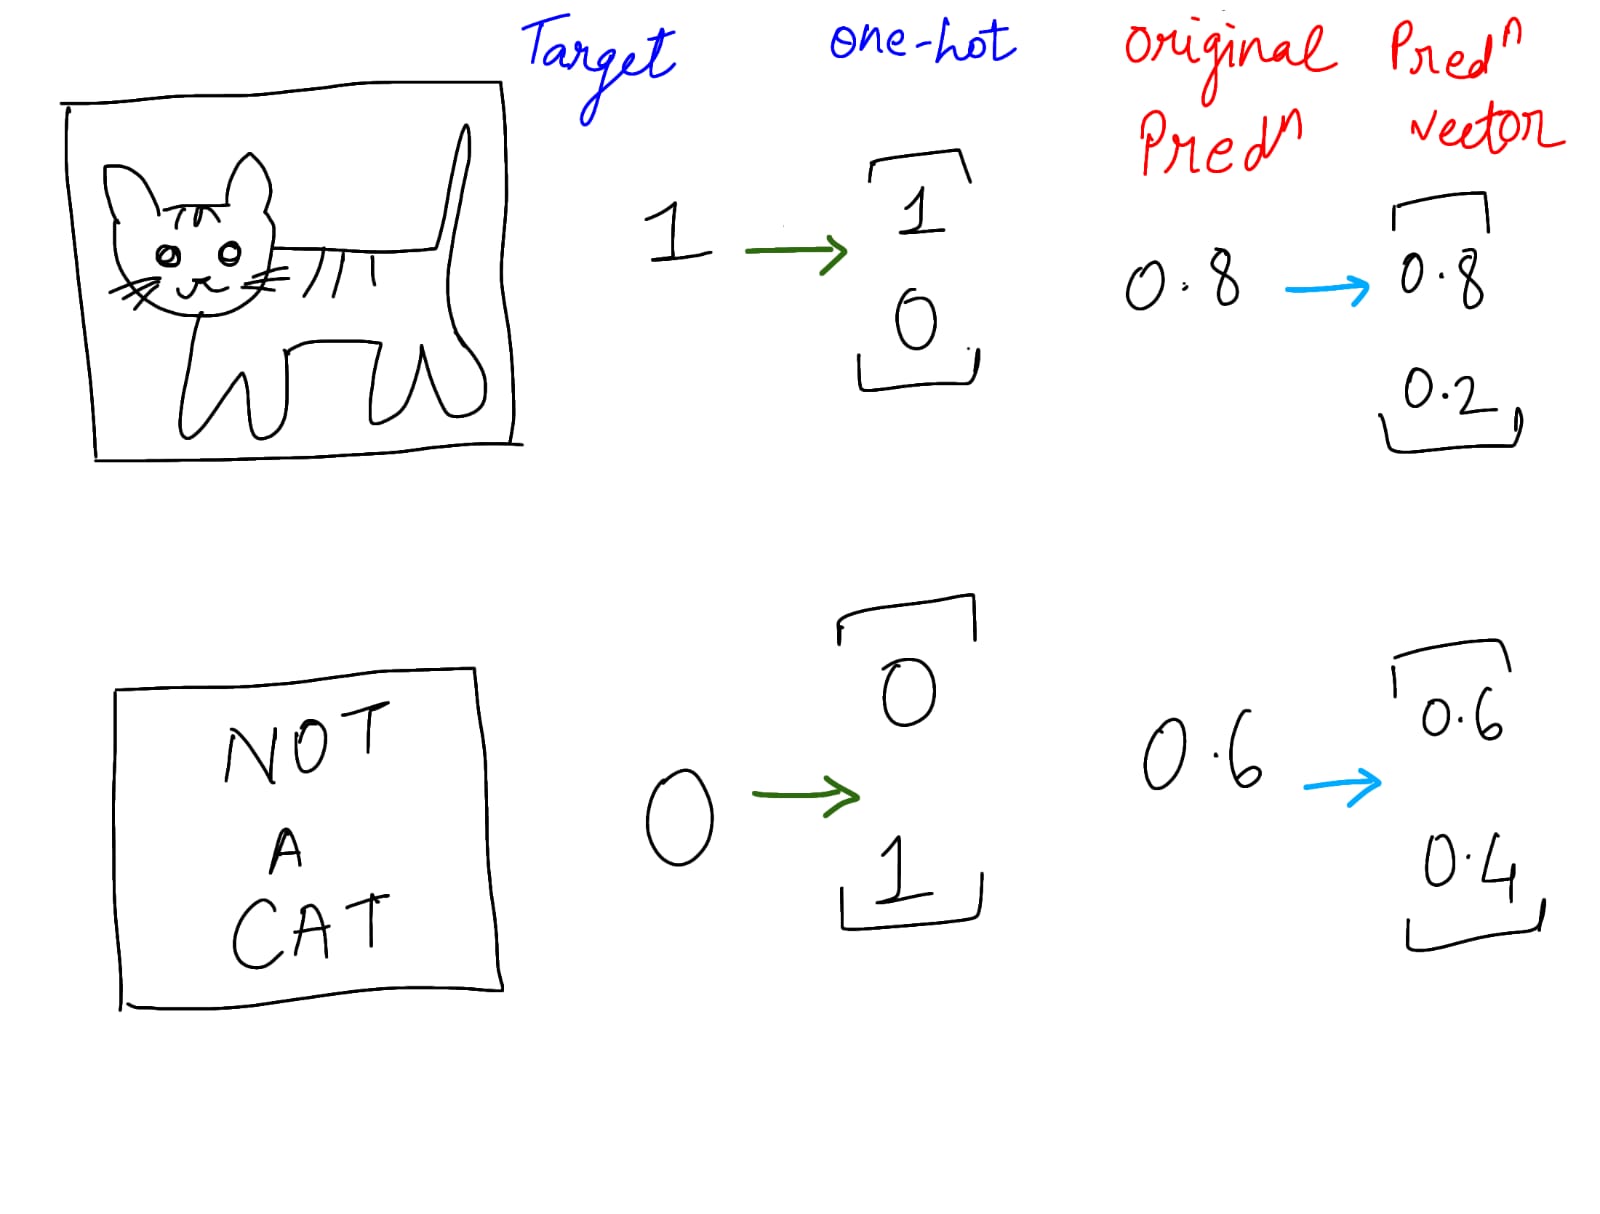
This is as simple as saying for 0.8 probability, which means 80 % it’s a cat and 20 % it is not a cat.
C. Multi-label classification
In multi-label classification, an image can contain more than one label. Therefore, our target and predictions are not probability vectors. It’s possible that all the classes are present in one image, and even none at all sometimes.

Here, we look at this problem as a multiple-binary classification subtask. Let us first predict if there is a cat or not.

Done! Great work, you managed to read till here. Want some more exciting examples – check here.
Authors: